Characteristics of the wellpoint system in relation to the type of soil
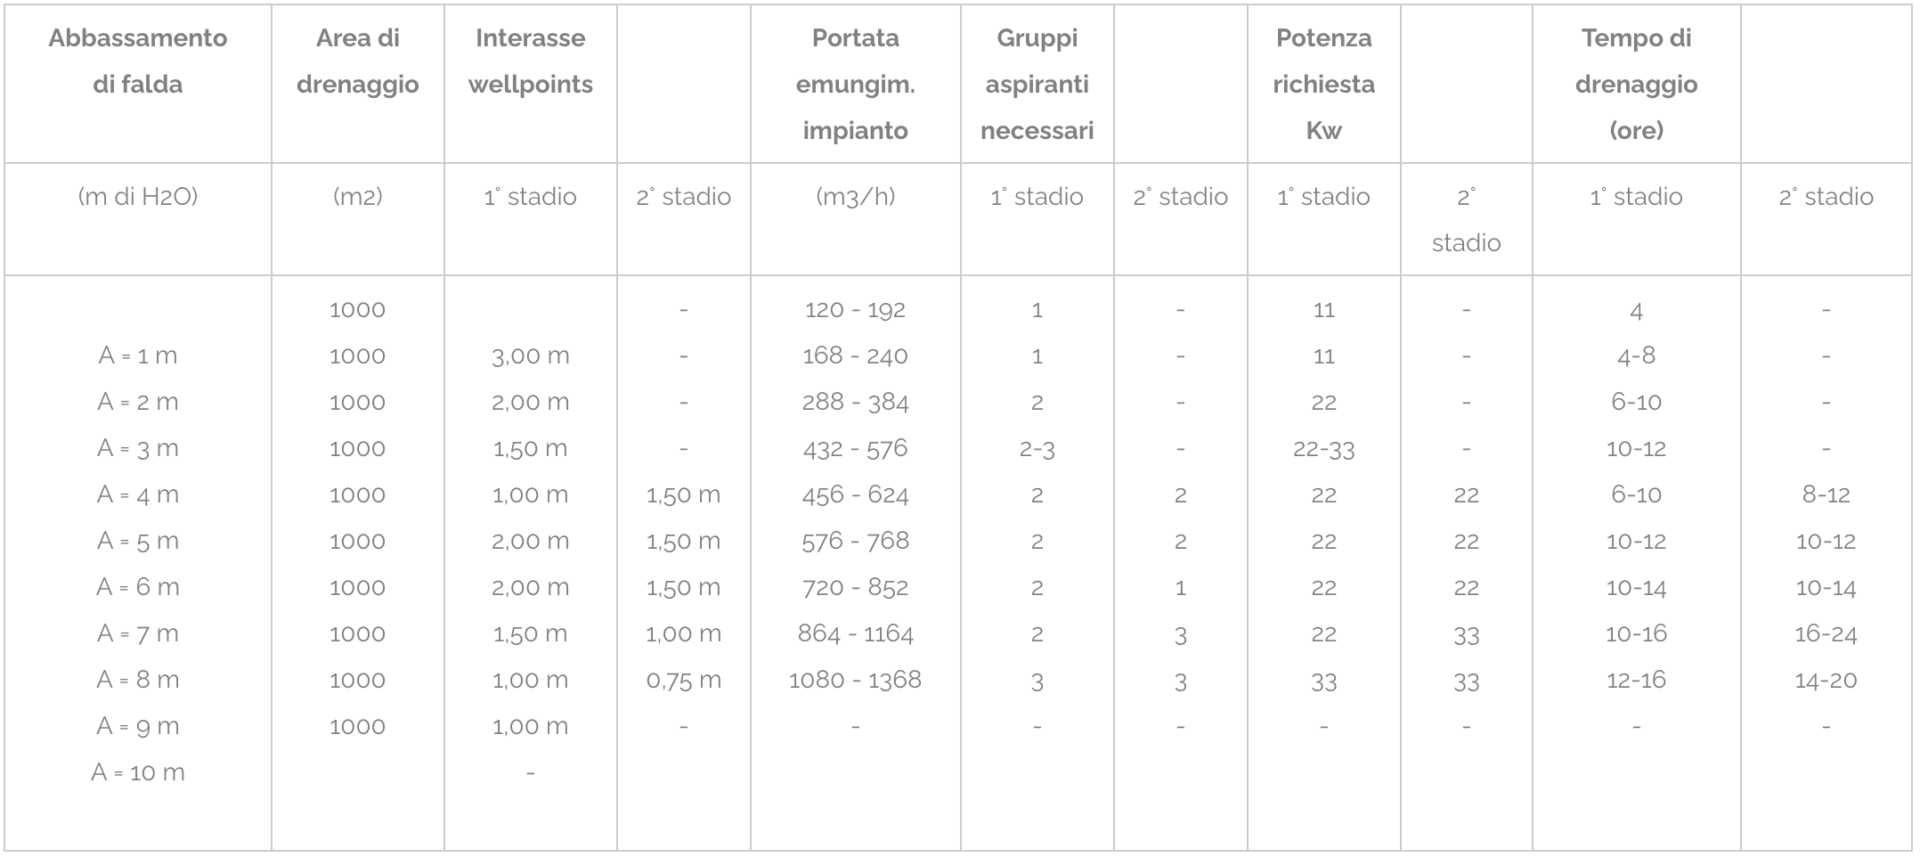
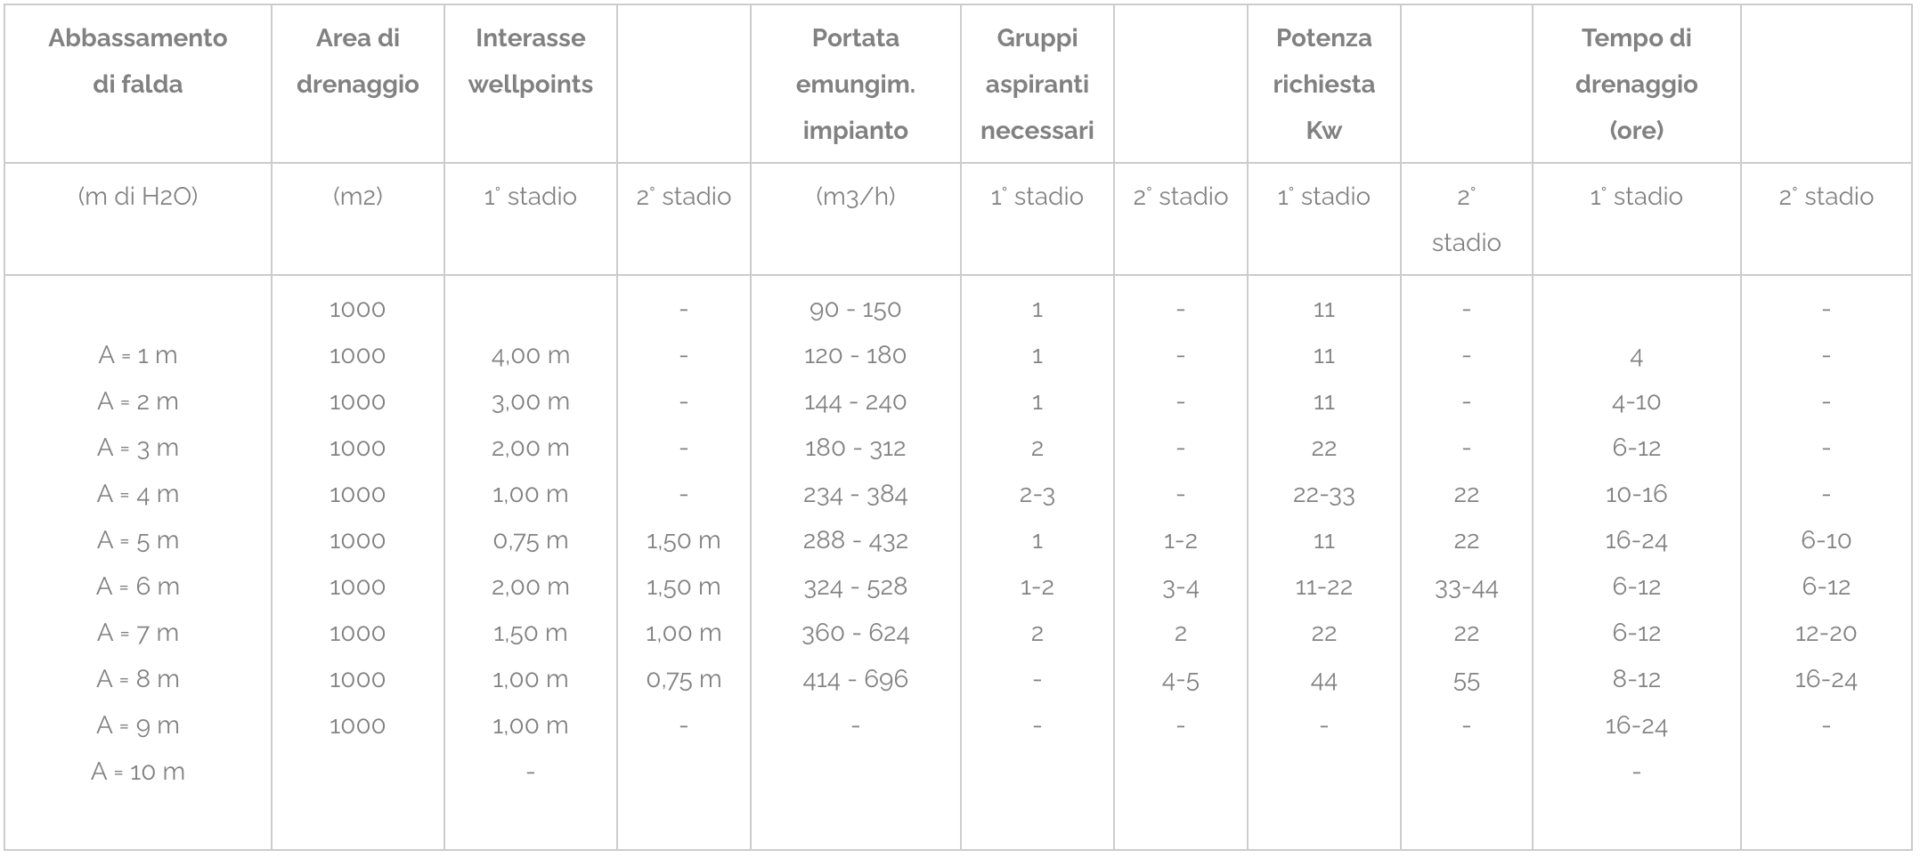
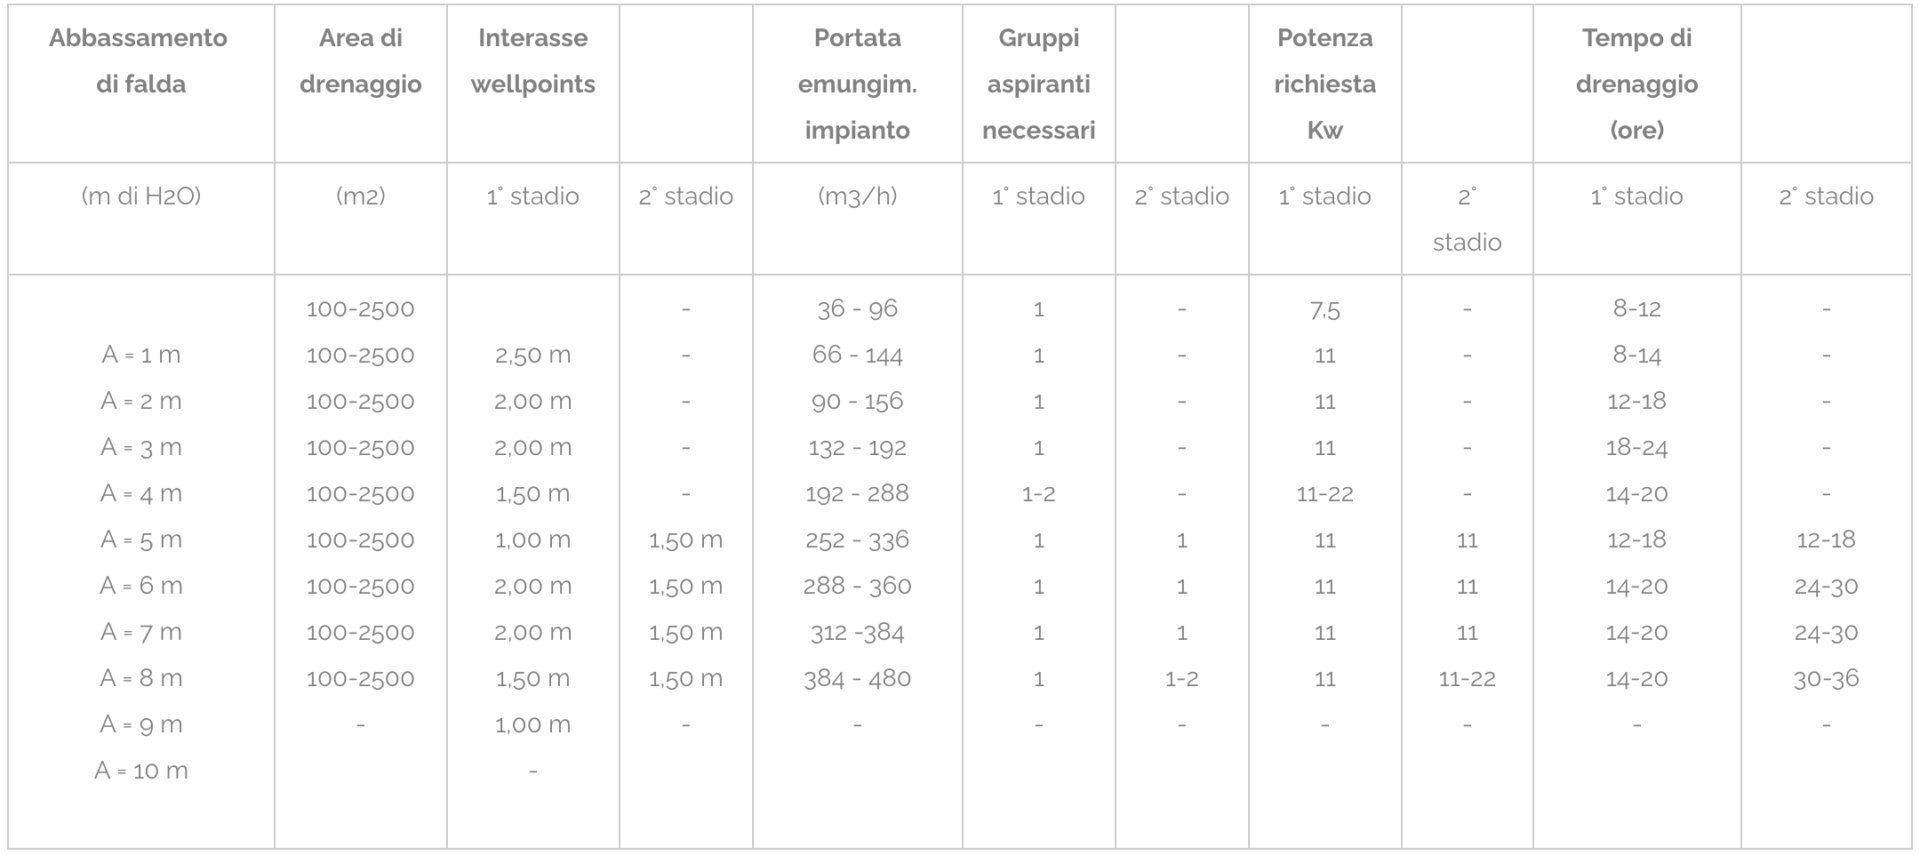
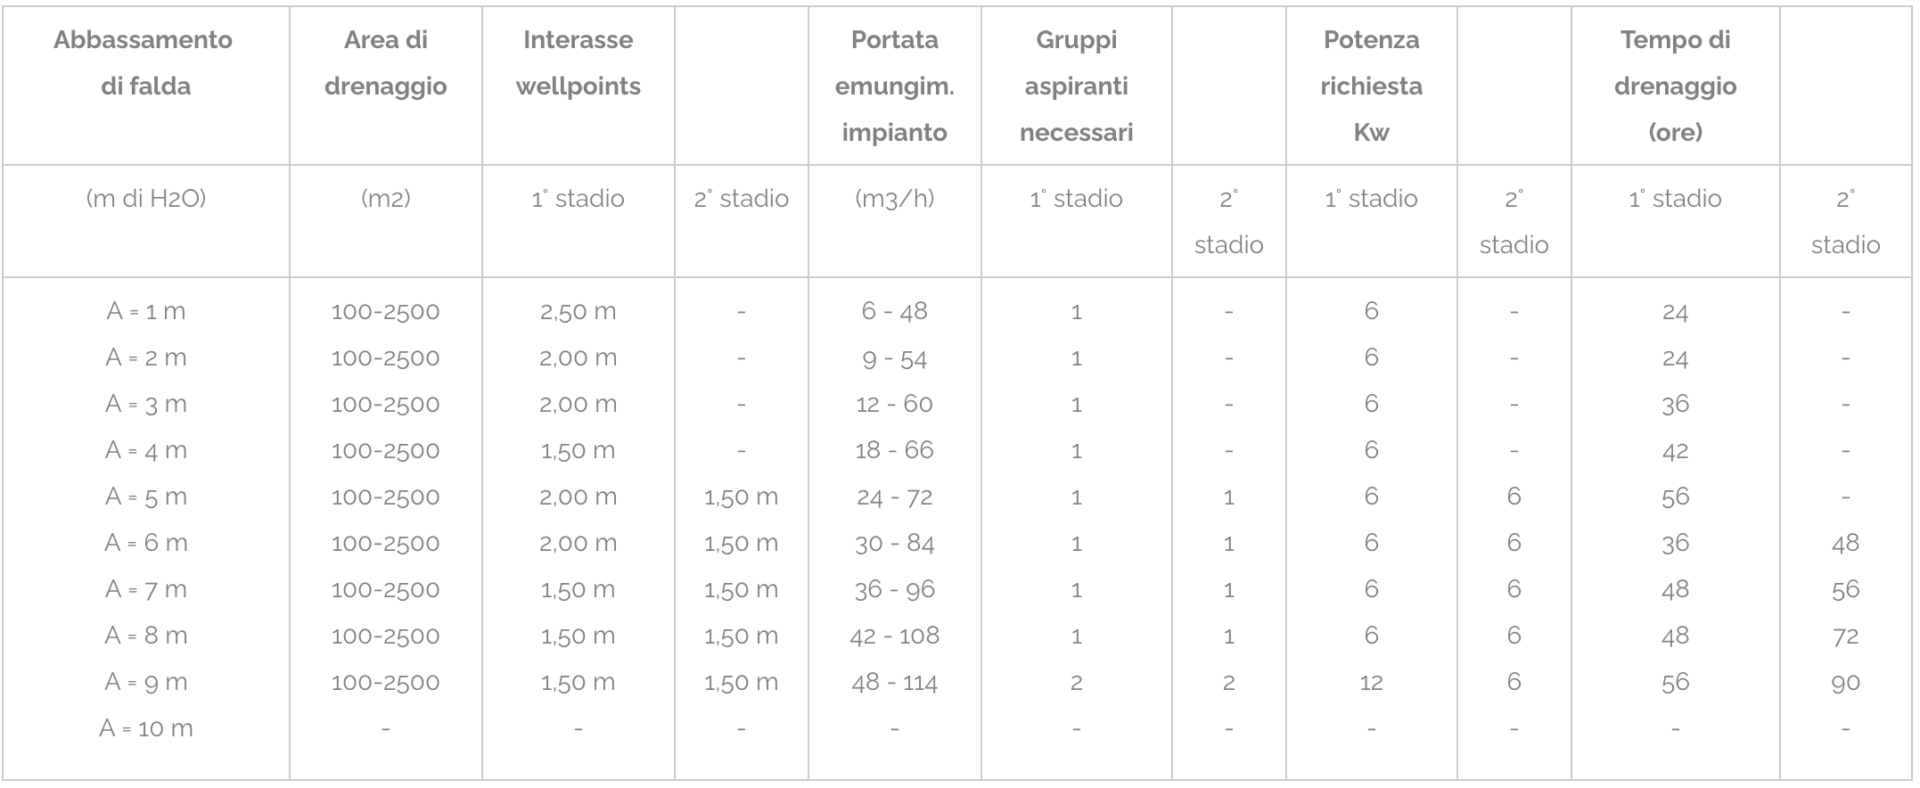
In the previous pages we have seen how in wellpoint systems the required power, the number of wellpoints and the drainage area are related to the type of land. The densely stratified soils, within certain limits, have a fairly similar behavior and, to the effects of drainage, the casuistry relating to the various possibilities of stratification can be traced back to a single model. The main characteristics of the wellpoint systems, divided by type of soil, are highlighted in some tables according to the classification shown in the following tables.
| Table n° | Soil type | Dimensions mm | Permeability K cm / sec. |
| 1 | Coarse sands and gravel | 0,5 – 6 | 10E-2 – 1 |
| 2 | Medium sands | 0,2 – 0,5 | 10E-3 – 10E-1 |
| 3 | Fine sands | 0,05 – 0,2 | 10E-4 – 10E-2 |
| 4 | Sands and clayey stratifications | 0,002 – 0,005 | 10E-7 – 10E-5 |
Tab.1
| Pitch lowering | Drainage area | Wheelbase wellpoints | System extraction flow rate | Suction groups needed | Power required Kw | Drainage time (hours) | ||||
| (m di H2O) | (m2) | 1° stage | 2° stage | (m3/h) | 1° stage | 2° stage | 1° stage | 2° stage | 1° stage | 2° stage |
|
A = 1 m |
1000 1000 1000 1000 1000 1000 1000 1000 1000 1000 |
3,00 m
|
– – – – 1,50 m 1,50 m 1,50 m 1,00 m 0,75 m – |
120 – 192 168 – 240 288 – 384 432 – 576 456 – 624 576 – 768 720 – 852 864 – 1164 1080 – 1368 – |
1 1 2 2-3 2 2 2 2 3 – |
– – – – 2 2 1 3 3 – |
11 11 22 22-33 22 22 22 22 33 – |
– – – – 22 22 22 33 33 – |
4 4-8 6-10 10-12 6-10 10-12 10-14 10-16 12-16 – |
– – – – 8-12 10-12 10-14 16-24 14-20 – |
Tab.2
| Pitch lowering | Drainage area | Wheelbase wellpoints | System extraction flow rate | Suction groups needed | Power required Kw | Drainage time (hours) | ||||
| (m di H2O) | (m2) | 1° stage | 2° stage | (m3/h) | 1° stage | 2° stage | 1° stage | 2° stage | 1° stage | 2° stage |
|
A = 1 m |
1000 1000 1000 1000 1000 1000 1000 1000 1000 1000 |
4,00 m
|
– – – – – 1,50 m 1,50 m 1,00 m 0,75 m – |
90 – 150 120 – 180 144 – 240 180 – 312 234 – 384 288 – 432 324 – 528 360 – 624 414 – 696 – |
1 1 1 2 2-3 1 1-2 2 – – |
– – – – – 1-2 3-4 2 4-5 – |
11 11 11 22 22-33 11 11-22 22 44 – |
– – – – 22 22 33-44 22 55 – |
4 4-10 6-12 10-16 16-24 6-12 6-12 8-12 16-24 – |
– – – – – 6-10 6-12 12-20 16-24 – |
Tab.3
| Pitch lowering | Drainage area | Wheelbase wellpoints | System extraction flow rate | Suction groups needed | Power required Kw | Drainage time (hours) | ||||
| (m di H2O) | (m2) | 1° stage | 2° stage | (m3/h) | 1° stage | 2° stage | 1° stage | 2° stage | 1° stage | 2° stage |
|
A = 1 m |
100-2500 100-2500 100-2500 100-2500 100-2500 100-2500 100-2500 100-2500 100-2500 – |
2,50 m
|
– – – – – 1,50 m 1,50 m 1,50 m 1,50 m – |
36 – 96 66 – 144 90 – 156 132 – 192 192 – 288 252 – 336 288 – 360 312 -384 384 – 480 – |
1 1 1 1 1-2 1 1 1 1 – |
– – – – – 1 1 1 1-2 – |
7,5 11 11 11 11-22 11 11 11 11 – |
– – – – – 11 11 11 11-22 – |
8-12 8-14 12-18 18-24 14-20 12-18 14-20 14-20 14-20 – |
– – – – – 12-18 24-30 24-30 30-36 – |
Tab.4
| Pitch lowering | Drainage area | Wheelbase wellpoints | System extraction flow rate | Suction groups needed | Power required Kw | Drainage time (hours) | ||||
| (m di H2O) | (m2) | 1° stage | 2° stage | (m3/h) | 1° stage | 2° stage | 1° stage | 2° stage | 1° stage | 2° stage |
| A = 1 m A = 2 m A = 3 m A = 4 m A = 5 m A = 6 m A = 7 m A = 8 m A = 9 m A = 10 m |
100-2500 100-2500 100-2500 100-2500 100-2500 100-2500 100-2500 100-2500 100-2500 – |
2,50 m |
– – – – 1,50 m 1,50 m 1,50 m 1,50 m 1,50 m – |
6 – 48 9 – 54 12 – 60 18 – 66 24 – 72 30 – 84 36 – 96 42 – 108 48 – 114 – |
1 1 1 1 1 1 1 1 2 – |
– – – – 1 1 1 1 2 – |
6 6 6 6 6 6 6 6 12 – |
– – – – 6 6 6 6 6 – |
24 24 36 42 56 36 48 48 56 – |
– – – – – 48 56 72 90 – |

Tab.1

Tab.2

Tab.3

Tab.4


